- Home
- SUSTAINABILITY
- Sustainability Data
- Environmental Data
Environmental Data
Data
The data marked with ● in the figure below has been third-party certified.
Assurance Statement for Environmental Data[PDF:817KB]
CO₂
Scope 1,2*1 (t)
| 2020 | 2021 | 2022 | 2023 | 2024 | |
|---|---|---|---|---|---|
| Total | 72,458● | 65,481● | 46,439● | 34,722● | 28,036●*3 |
| Coverage(%) *2 | 100.0 | 100.0 | 100.0 | 100.0 | 100.0 |
| Scope1 | 25,968● | 28,744● | 23,912● | 21,105● | 17,825● |
| Coverage(%) *2 | 100.0 | 100.0 | 100.0 | 100.0 | 100.0 |
| Scope2 | 46,490● | 36,737● | 22,527● | 13,617● | 10,212● |
| Coverage(%) *2 | 100.0 | 100.0 | 100.0 | 100.0 | 100.0 |
- *1:Targeting energy-derived CO₂ and the performance data was calculated based on the GHG Protocol.
Scope 2 emissions are calculated using the market-based method. In 2024, the location-based emissions amounted to 52,385 t● - *2:At all sites.
- *3:Total emissions after the deduction of carbon credits (for 5,990 t●) is 22,046 t
Scope3*1 (t)
| 2020 | 2021 | 2022 | 2023 | 2024 | |
|---|---|---|---|---|---|
| Total | 2,540,000 | 1,520,000 | 1,510,000 | 973,000 | 925,000 |
| Category 1 Purchased goods and services *2, *3 |
528,000● | 953,000● | 931,000● | 509,000● | 474,000● |
| Category 2 Capital goods |
246,000 | 225,000● | 150,000● | 139,000● | 123,000● |
| Category 3 Fuel and energy related activities |
13,200 | 12,600 | 9,500 | 9,740 | 8,710 |
| Category 4 Upstream transportation and distribution |
85,400 | 51,600● | 67,500● | 37,200● | 44,400● |
| Category 5 Waste generated in operations |
33,000 | 15,100● | 15,500● | 13,900● | 23,900● |
| Category 6 Business travel |
1,600 | 900 | 2,400 | 9,460 | 6,310 |
| Category 7 Employee commuting |
6,200 | 8,500 | 7,500 | 7,990 | 7,580 |
| Category 8 Upstream leased assets *4 |
0 | 0 | 0 | 0 | 9 |
| Category 9 Downstream transportation and distribution *5 |
- | - | 87,000● | 74,300● | 65,000● |
| Category 10 Processing of sold products |
0 | 0 | 0 | 0 | 0 |
| Category 11 Use of sold products |
1,540,000● | 134,000● | 143,000● | 108,000● | 121,000● |
| Category 12 End of life treatment of sold products |
82,900● | 118,000● | 94,600● | 59,400● | 49,300● |
| Category 13 Downstream leased assets |
0 | 0 | 0 | 0 | 0 |
| Category 14 Franchises |
0 | 0 | 0 | 0 | 0 |
| Category 15 Investments *5 |
- | - | 2,800 | 4,940 | 1,470 |
- *1:Used IDEA v3.1 and ecoinvent v3.9 as CO₂ calculation basis database.
- *2:Amount of materials used in Japan in 2024 (including estimates): glass 3,200 t, metal 630 t
- *3:Emissions from land-use change related to the procurement of raw materials and ingredients were taken into account from 2021.
- *4:Upstream leased assets were taken into account from 2024.
- *5:Downstream transportation & distribution and Investments were taken into account from 2022.
Scope1,2,3 Total (t)
| 2020 | 2021 | 2022 | 2023 | 2024 | |
|---|---|---|---|---|---|
| Total | 2,612,458 | 1,585,481 | 1,556,439 | 1,008,126 | 953,036 |
Avoided CO₂ emissions (t)
Through the sale of refillable products, we achieved a reduction of approximately 4,300 tons of CO₂ emissions.
| Each stage of the value chain | Avoided CO₂ emissions |
|---|---|
| Procurement | 2,900 |
| End of life | 1,300 |
| Total | 4,200 |
Energy (MWh)
| 2020 | 2021 | 2022 | 2023 | 2024 | |
|---|---|---|---|---|---|
| Energy consumption | 298,589 | 322,527 | 304,962 | 239,863 | 230,011●*4 |
| Coverage (%)*1 | 100.0 | 100.0 | 100.0 | 100.0 | 100.0 |
| Electric power | 127,188 | 137,881 | 141,841 | 127,305 | 114,698● |
| Gas*2 | 128,568 | 139,424 | 109,953 | 58,413 | 70,344● |
| LPG | 2,552 | 2,370 | 2,559 | 1,778 | 13● |
| Fuel*3 | 16,146 | 20,181 | 20,436 | 24,129 | 19,760● |
| Steam | 24,135 | 22,671 | 30,172 | 28,239 | 25,195● |
- *1:At all our sites.
- *2:Total consumption of city gas and natural gas.
- *3:Total consumption of gasoline, kerosene, diesel oil and fuel oil.
- *4:Non-renewable energy consumption in 2024 : 128,071 MWh●, renewable energy cunsumption in 2024 : 101,939 MWh●
Water* (Mil. m³)
| 2020 | 2021 | 2022 | 2023 | 2024 | |
|---|---|---|---|---|---|
| Water withdrawals | 1.2● | 1.2● | 1.1● | 0.8● | 0.6● |
| Municipal water | 0.9 | 0.9 | 0.7 | 0.5● | 0.4● |
| Municipal water (Industrial grade) | 0.1 | 0 | 0 | 0● | 0● |
| Ground water | 0.3 | 0.3 | 0.3 | 0.3● | 0.2● |
| Water discharged | 1.0● | 1.0● | 0.9● | 0.6● | 0.5● |
| Sewage | 0.8 | 0.8 | 0.8 | 0.4 | 0.3 |
| Surface water | 0.2 | 0.2 | 0.1 | 0.2 | 0.2 |
-
*2020: Production sites (Coverage:100%).
2021: Production sites (Coverage:100%) and domestic research centers (Coverage: 100%).
2022-2024: Production sites (Coverage:100%) and research centers (Coverage:100%).
-Other sources of water withdrawals (surface water, harvested rainwater, external wastewater, sea water, quarry water) in 2020-2024: 0m³
-Total net fresh water consumption in 2024 (water consumption excluding the amount of wastewater returned to the same water source): 0.6 million m³●
Waste generated in operations*1 (t)
| 2020 | 2021 | 2022 | 2023 | 2024 | |
|---|---|---|---|---|---|
| Waste discharged | 12,825 | 13,096● | 12,560● | 10,895● | 8,694● |
| Recycled*2 | 12,779 | 13,038 | 12,473 | 10,813● | 8,572● |
| Disposed*3 | 47 | 58● | 87● | 81● | 122● |
- *1:2020-2021: Production sites(Coverage 100%) and domestic research centers.
2022-2024: Production sites(Coverage 100%) and research centers(Coverage 100%). - *2:Waste directed for recycling, including thermal recovery.
- *3:Waste directed for disposal.
Environmental pollution (Air/Water)(t)
| 2020 | 2021 | 2022 | 2023 | 2024 | |
|---|---|---|---|---|---|
| NOx emissions | 23● | 24● | 31● | 10● | 5● |
| Coverage(%) *1 | 90.9 | 100.0 | 100.0 | 100.0 | 100 |
| SOx emissions | 0● | 0● | 0● | 0● | 0.0● |
| Coverage(%) *1 | 90.9 | 91.7 | 91.7 | 91.7 | 100.0 |
| Chemical Oxygen Demand | 70● | 68● | 52● | 46● | 33● |
| Coverage(%) *1 | 90.9 | 91.7 | 92.3 | 92.3 | 100.0 |
- *Production sites. (COD applies to production sites that are legally required to measure emissions)
Compliance with Environmental Regulations
The company’s key focus regarding environmental law is on its production sites. Shiseido ensures thorough compliance with environmental laws and regulations by conducting evaluations based on ISO 14001 standards.
Investigations of both domestic and overseas affiliates have shown no significant violations of environmental laws or regulations in the past five years, including 2024.
Shiseido remains committed to maintaining appropriate management practices that comply with environmental laws and regulations.
We assess the environmental footprint including CO₂ emissions regarding products.
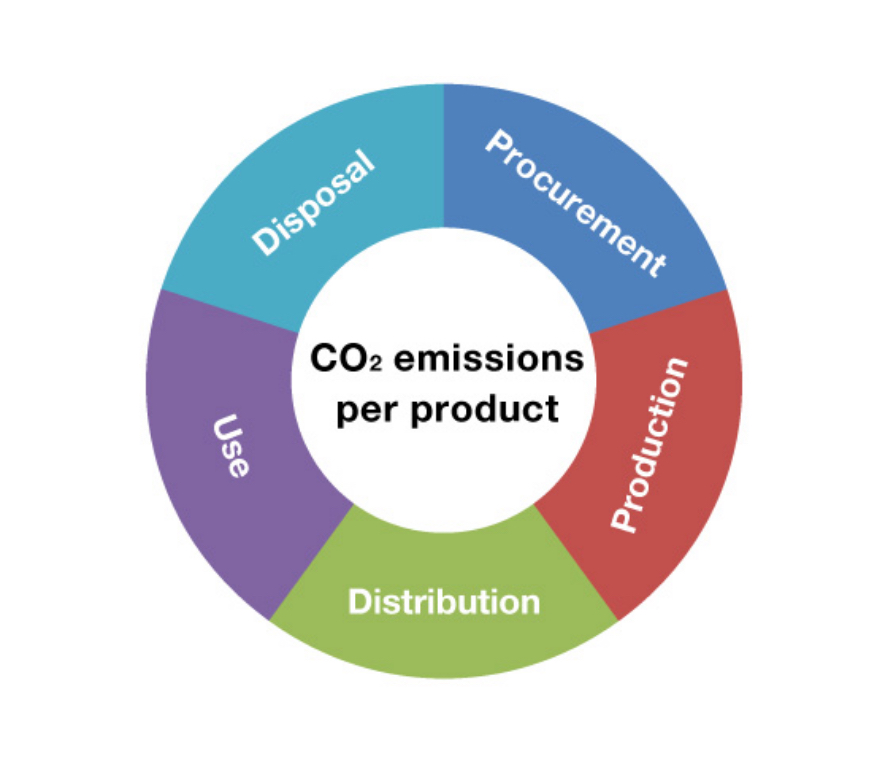
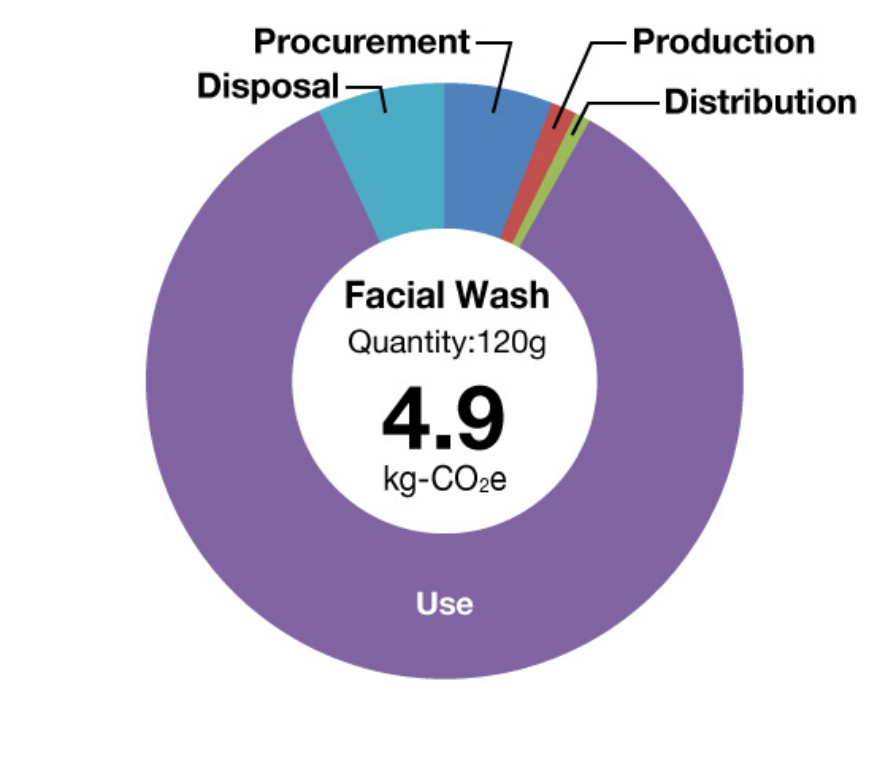
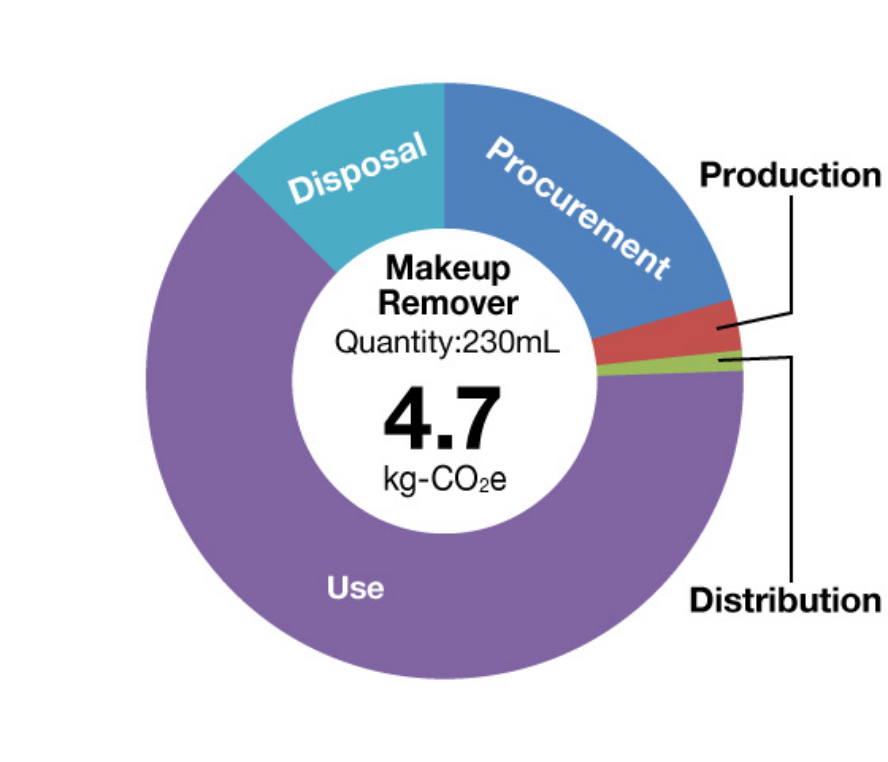
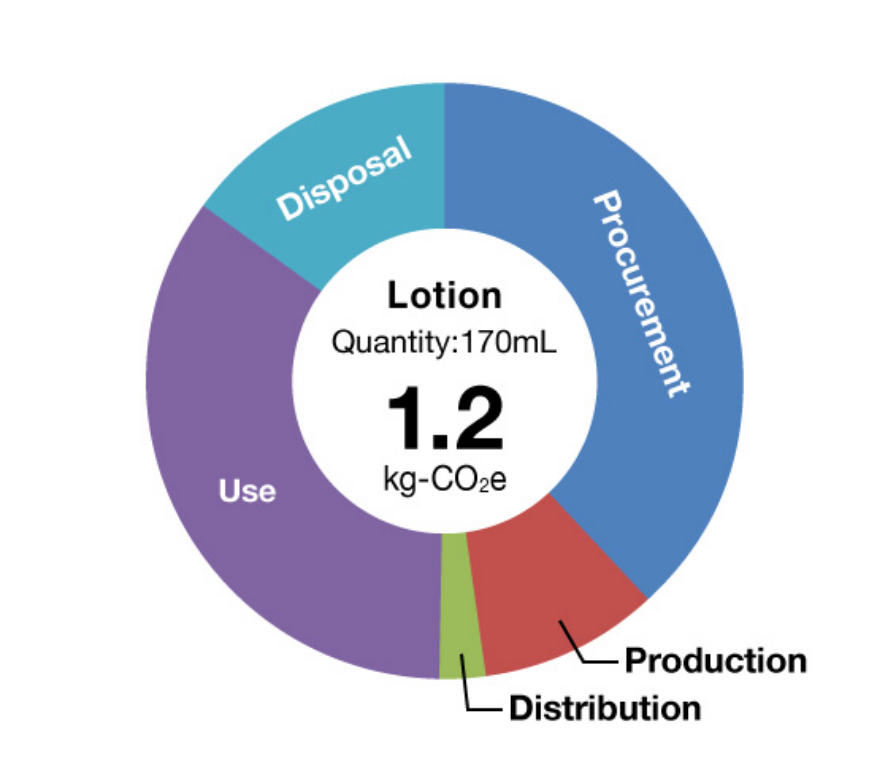
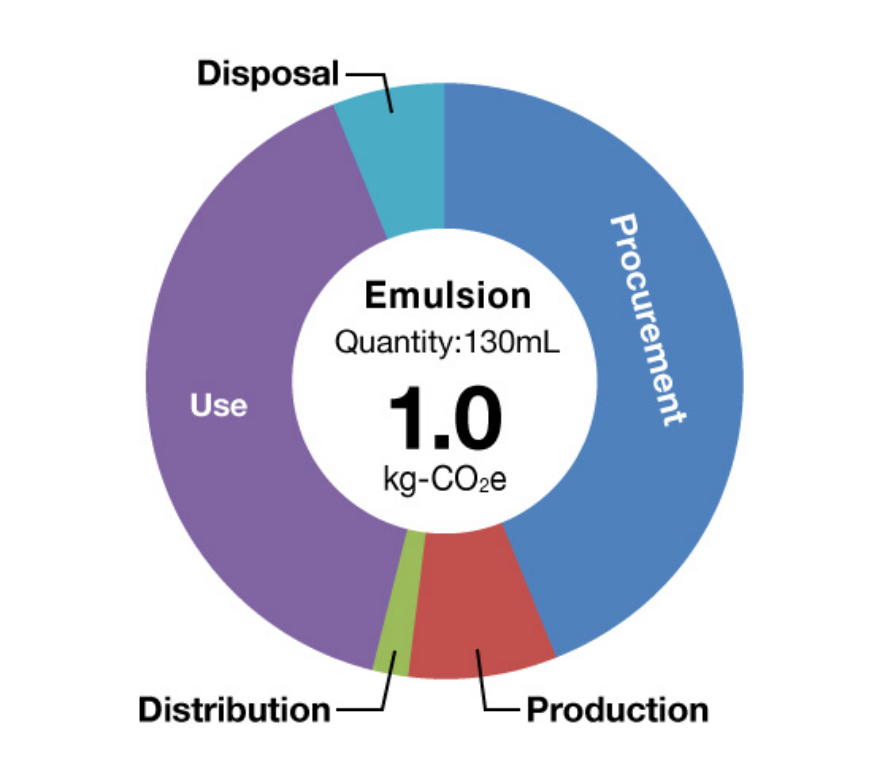
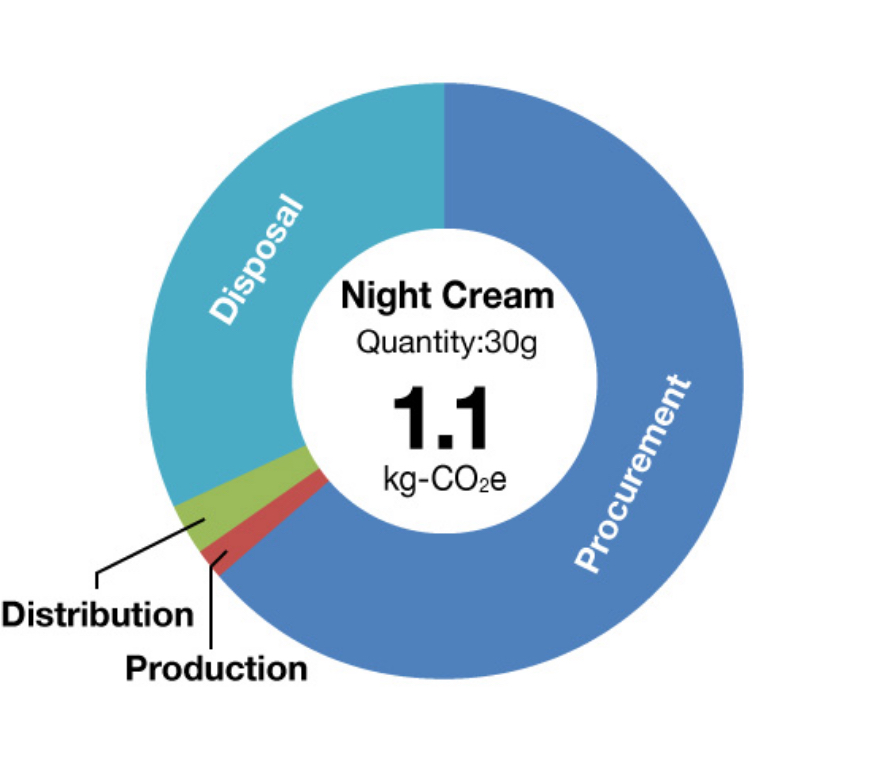
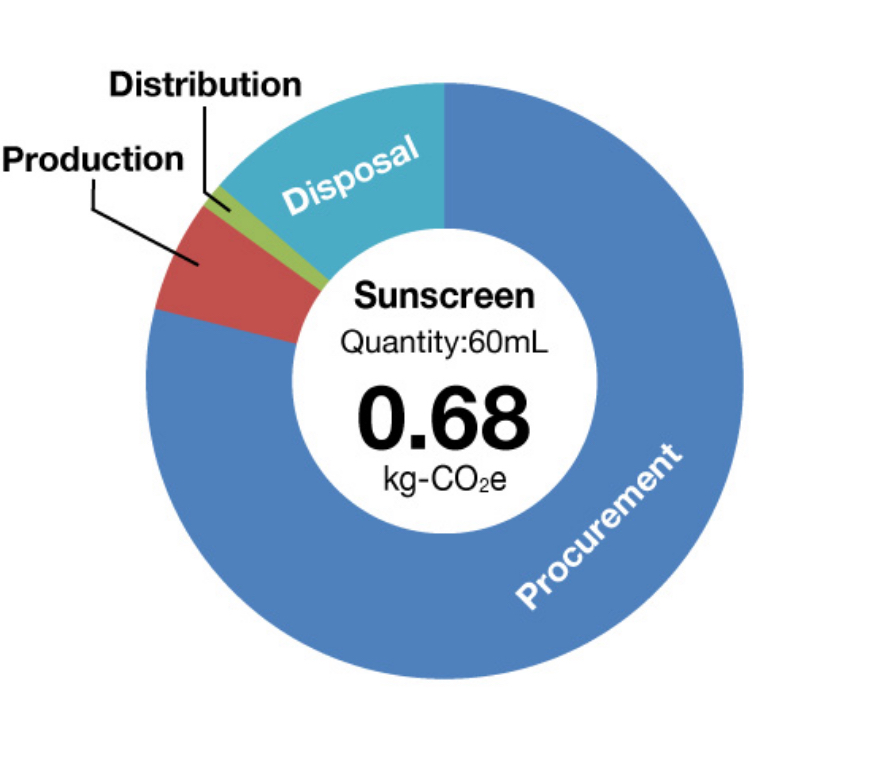
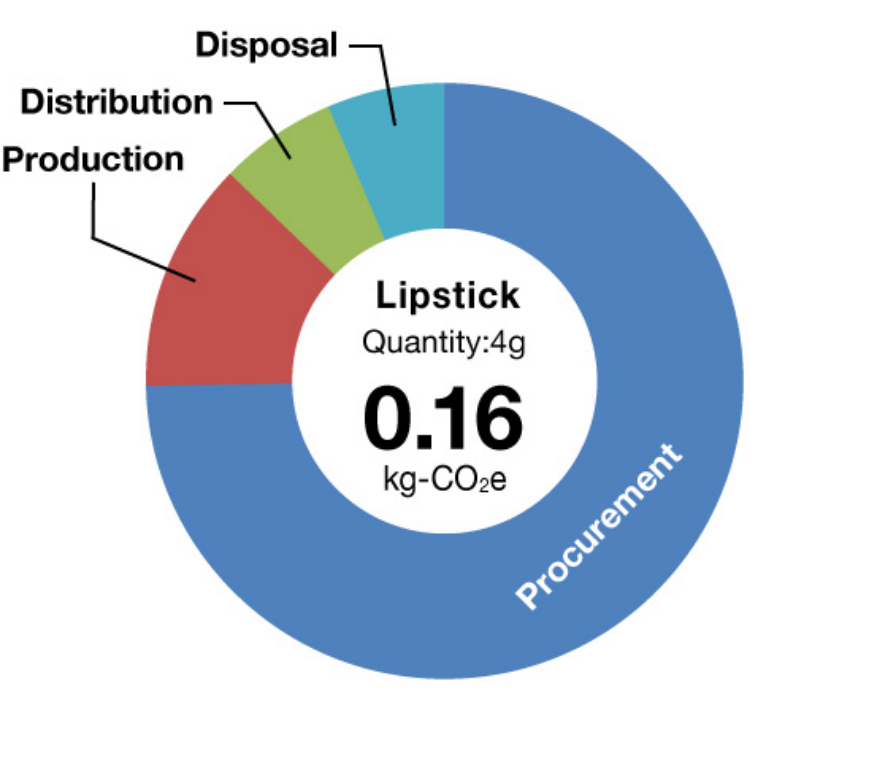
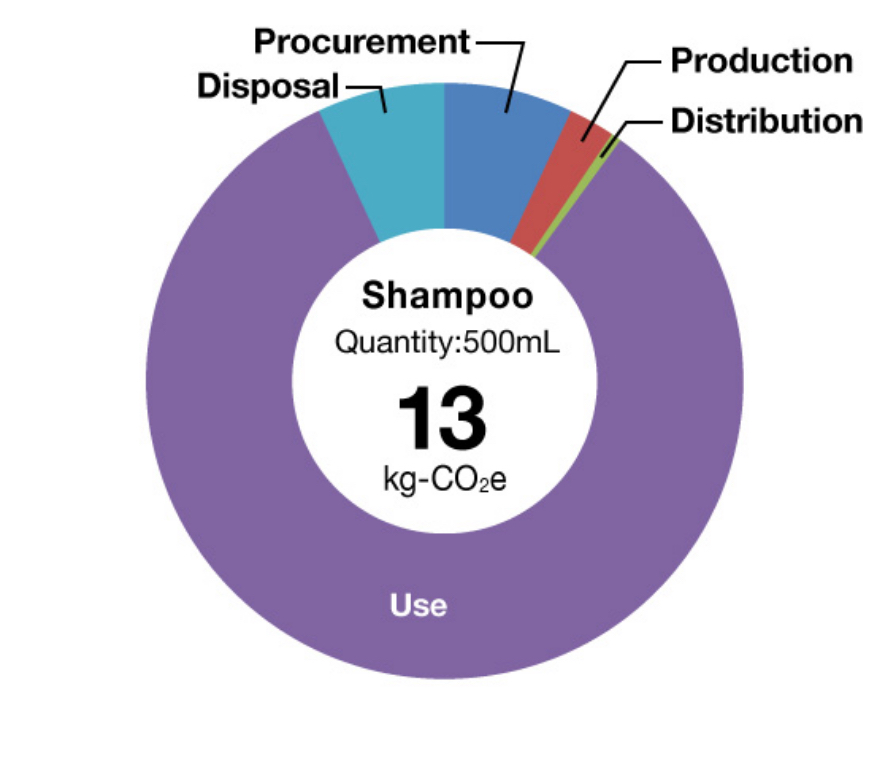
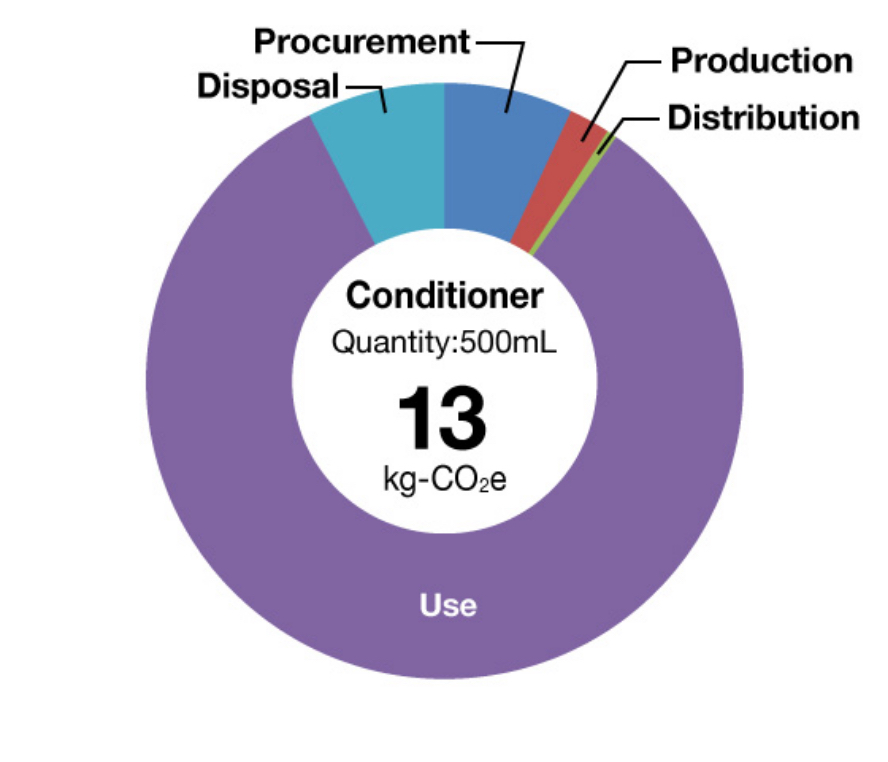
- *The calculation of usage phase was evaluated by setting the following usage scenarios.
| Type | Usage scenario |
|---|---|
| Facial wash | Rinse the face with 4.11L of hot water at 40°C |
| Makeup remover | Rinse the face with 4.5L of hot water at 33°C |
| Lotion, emulsion | Use a cotton pad and apply all over the face |
| Shampoo, conditioner | Rinse the face with 15L of hot water at 40°C |
ABOUT US
-
Who we are
-
History
-
Profile
-
Governance
-
Quality Management
-
Supply Network
-
Region/Business
BRANDS
-
Prestige
-
Premium
-
Inner Beauty
-
Life Quality Makeup
SUSTAINABILITY
-
Strategy / Management
-
Society
-
Environment
-
Governance
-
Reports / Data
-
Related Information
INNOVATION
-
Research and Development
-
Research Areas
-
Research outcomes
-
Product safety
-
Product Development Policy
-
Initiatives for doctors and researchers
CAREERS
-
DISCOVER OUR WORLD OF OPPORTUNITY
- Shiseido careers
INVESTORS
-
IR Library