Regional Overview

Six Regional Headquarters and Our Global Management Structure

Since 2016, we have had in place a matrix organization that cross-matches six regions with brand categories. The regional headquarters are responsible for and have authority over their respective businesses. Guided by a “Think Global, Act Local” approach, these headquarters implement flexible decision-making and marketing activities attuned to the needs of local consumers.
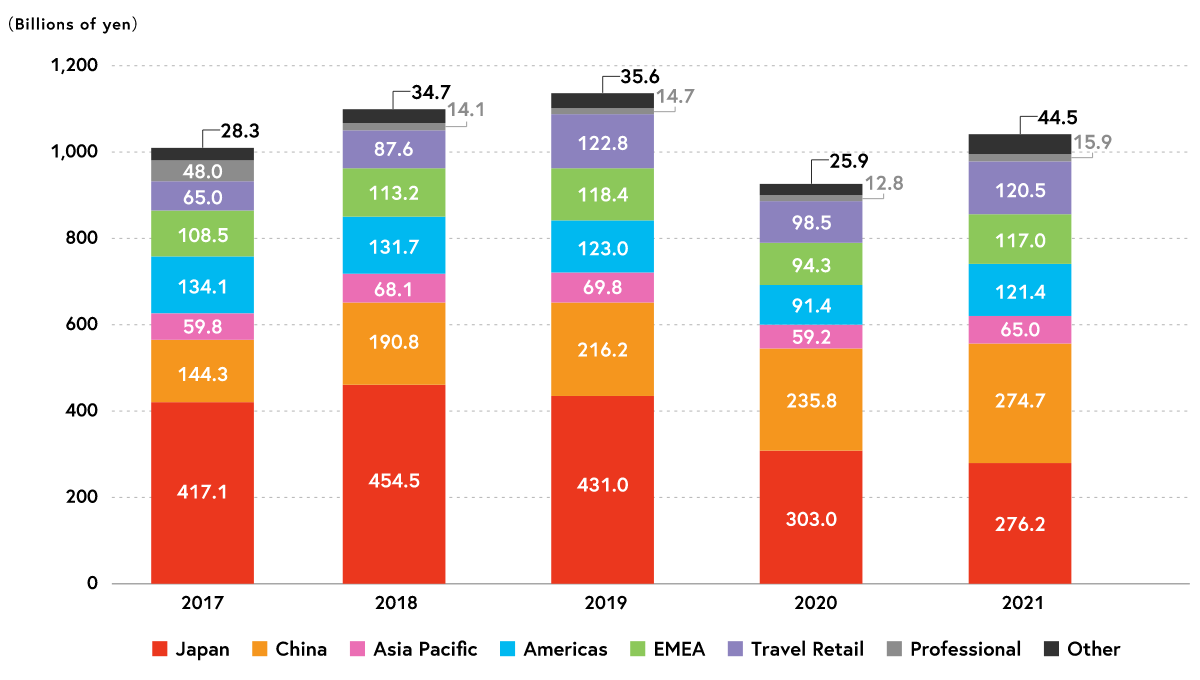
2021 Results

Net Sales by Reportable Segment

Net Sales by Reportable Segment

(Billion yen)
2020
2021
YoY Change
YoY Change %
YoY Change
FX-Neutral %
Like-for-Like %
Japan
303.0
276.2
−26.9
−8.9%
−8.9%
−1.4%
China
235.8
274.7
+38.9
+16.5%
+7.0%
+19.1%
Asia Pacific
59.2
65.0
+5.8
+9.9%
+3.8%
+5.8%
Americas
91.4
121.4
+30.0
+32.8%
+28.4%
+29.9%
EMEA
94.3
117.0
+22.8
+24.1%
+16.4%
+16.5%
Travel Retail
98.5
120.5
+22.0
+22.3%
+18.4%
+18.4%
Professional
12.8
15.9
+3.1
+24.4%
+19.6%
+19.6%
Other
25.9
44.5
+18.6
+71.7%
+70.8%
+2.1%
Total
920.9
1,035.2
+114.3
+12.4%
+7.8%
+11.9%

Net Sales and Operating Profit by Region

(Billion yen)
2020
2021
YoY Change
YoY Change
%
Operating Profit
OPM %
Operating Profit
OPM %
Japan
9.7
2.9%
9.6
3.2%
−0.1
−0.9%
China
18.4
7.8%
1.2
0.4%
−17.2
−93.6%
Asia Pacific
3.2
5.3%
3.7
5.6%
+0.5
+15.1%
Americas
−22.7
−19.5%
−13.2
−8.9%
+9.5
-
EMEA
−13.2
−12.9%
2.5
1.9%
+15.7
-
Travel Retail
14.6
14.8%
22.0
18.2%
+7.3
+49.9%
Professional
−0.0
−0.3%
0.8
4.6%
+0.8
-
Other
4.7
2.7%
31.0
13.3%
+26.3
+556.0%
Subtotal
14.7
1.3%
57.4
4.5%
+42.7
+290.6%
Adjustment
0.3
-
−15.8
-
−16.1
-
Total
15.0
1.6%
41.6
4.0%
+26.6
+177.9%

Operating Margin by Reportable Segment (%)

2017
2018
2019
2020
2021
Japan
18.0
18.8
16.7
2.9
3.2
China
6.1
12.8
13.5
7.8
0.4
Asia Pacific
10.3
11.1
10.2
5.3
5.6
Americas
−13.9
−8.7
−4.6
−19.5
−8.9
EMEA
−2.3
−6.4
−1.7
−12.9
1.9
Travel Retail
27.6
20.0
25.4
14.8
18.2
Professional
6.1
3.9
2.2
−0.3
4.6
Other
−6.5
−4.4
−5.6
2.7
13.3