Corporate Information

- Founded
- 1872
- Position amongst Global Manufacturers
- No.5
- Position amongst Japan and Asia Cosmetics Manufacturers
- No.1
CORPORATE
INFORMATION
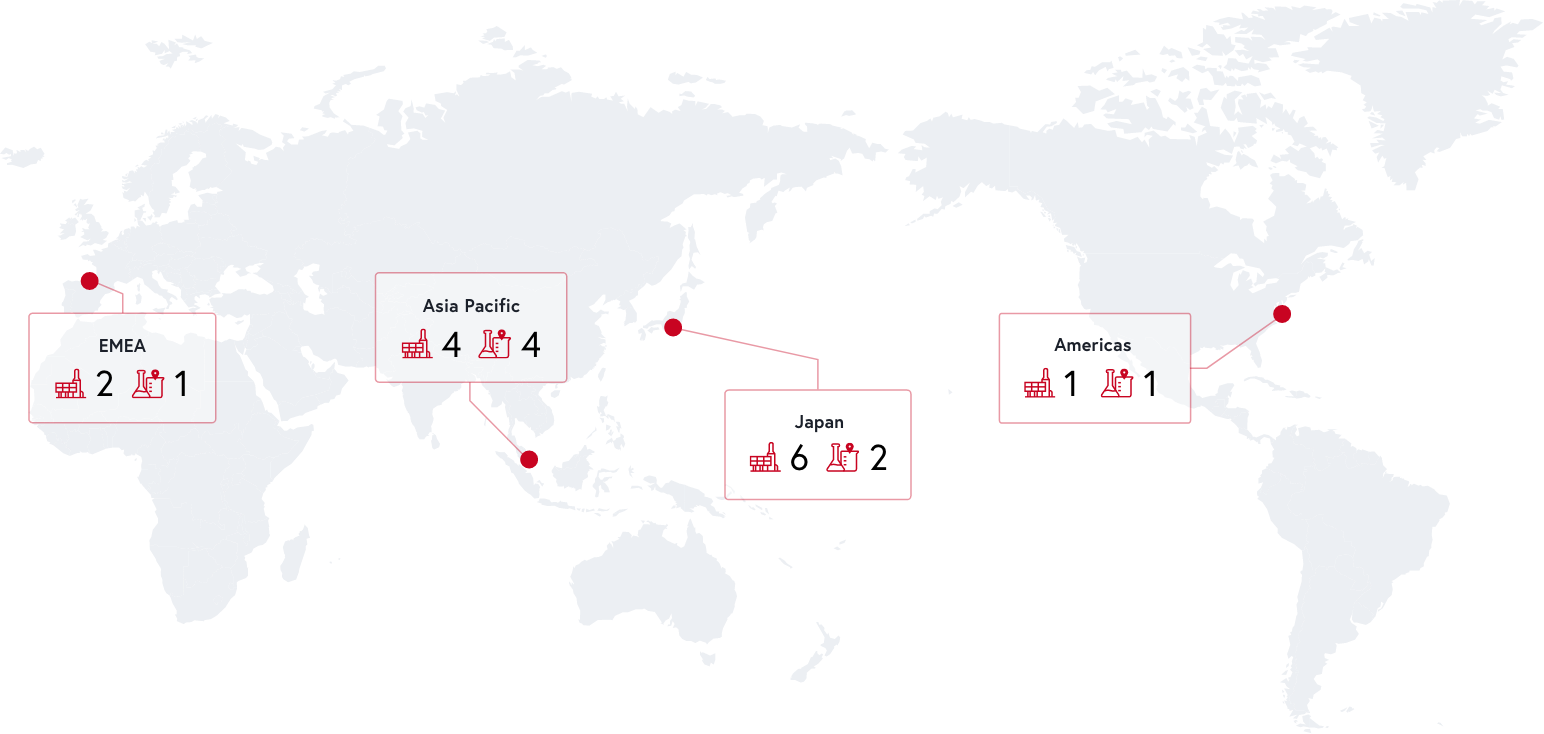
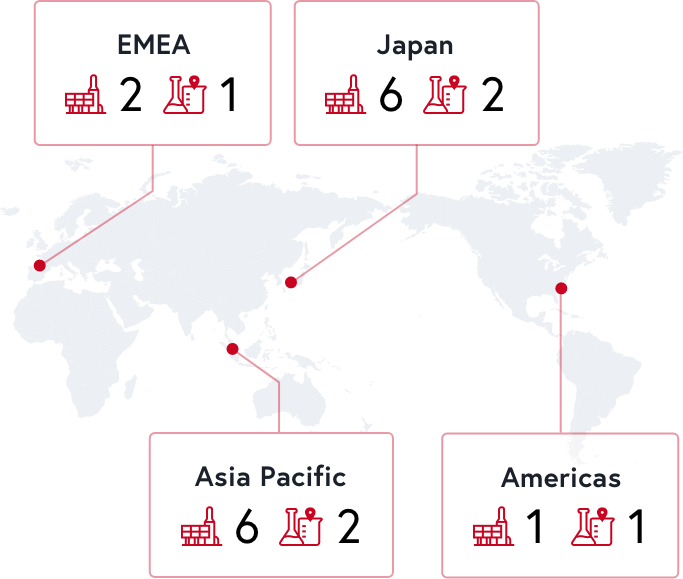
Global Expansion
- Countries and Regions Served
- Approx.120
- Production Sites
- 13
- R&D Sites
- 8
GLOBAL
EXPANSION
Employees

EMPLOYEES
- Employees
- Approx.42,000
- Nationalities
Employed - Approx.100
- Percentage of Female Leaders
- 58.3%
Japan37.3%
Overseas70.7%
Japan37.3%
Overseas70.7%
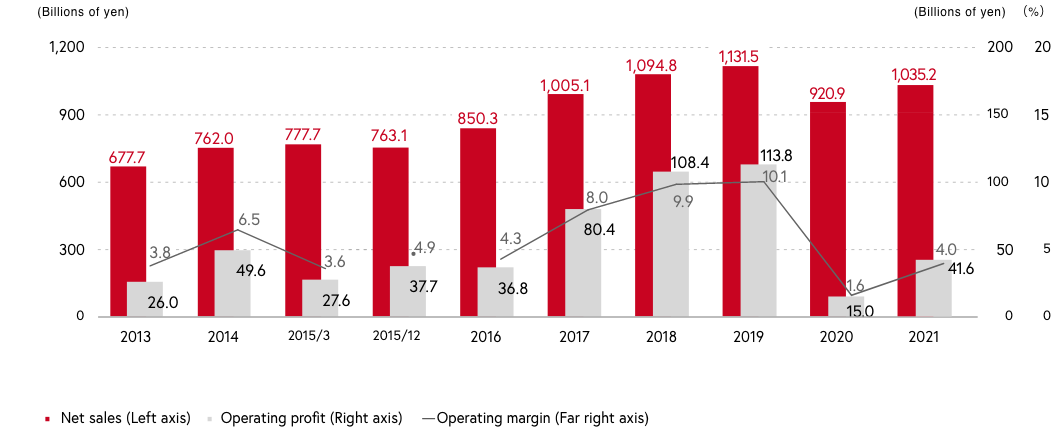
2021 Results
- Net Sales
- ¥1,035.2bn
YoY
+12%
FX-neutral
+8%
Like-for-like
+12%
- Operating Profit
- ¥41.6bn
YoY
+178%
- Operating Margin
- 4.0%
YoY
+2.4pts
- ROIC
- 3.3%
- ROE
- 8.2%
- Net Sales/Operating Profit/Operating Margin
YoY
+12%
FX-neutral
+8%
Like-for-like
+12%
YoY
+178%
YoY
+2.4pts
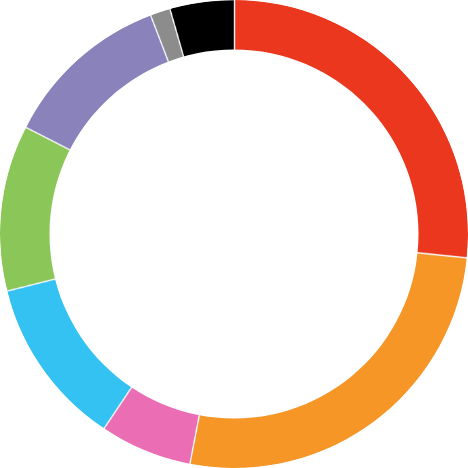
Net Sales and Sales Ratio by Business Segment
YoY growth (like-for-like)
Japan
26.7%
- Net Sales
- ¥276.2bn
- YoY
- -1.4%
China
26.6%
- Net Sales
- ¥274.7bn
- YoY
- +19.1%
Asia Pacific
6.3%
- Net Sales
- ¥65.0bn
- YoY
- +5.8%
Americas
11.7%
- Net Sales
- ¥121.4bn
- YoY
- +29.9%
EMEA
11.3%
- Net Sales
- ¥117.0bn
- YoY
- +16.5%
Travel Retail
11.6%
- Net Sales
- ¥120.5bn
- YoY
- +18.4%
Professional
1.5%
- Net Sales
- ¥15.9bn
- YoY
- +19.6%
Others
4.3%
- Net Sales
- ¥44.5bn
- YoY
- +2.1%
PERFORMANCE
Focus Growth Areas
- Skincare Sales Ratio
- 64%WIN 2023 and Beyond
Skincare Sales Growth
+10%
- Skincare Sales Growth
- +10%
- Prestige Sales Ratio
- 50%Business Categories and Brands
YoY
+3.9pts
- YoY
- +3.9pts
- EC Sales Ratio
- 34%Overview of Business Segments
EC Sales Growth
Over20%
- EC Sales Growth
- Over20%
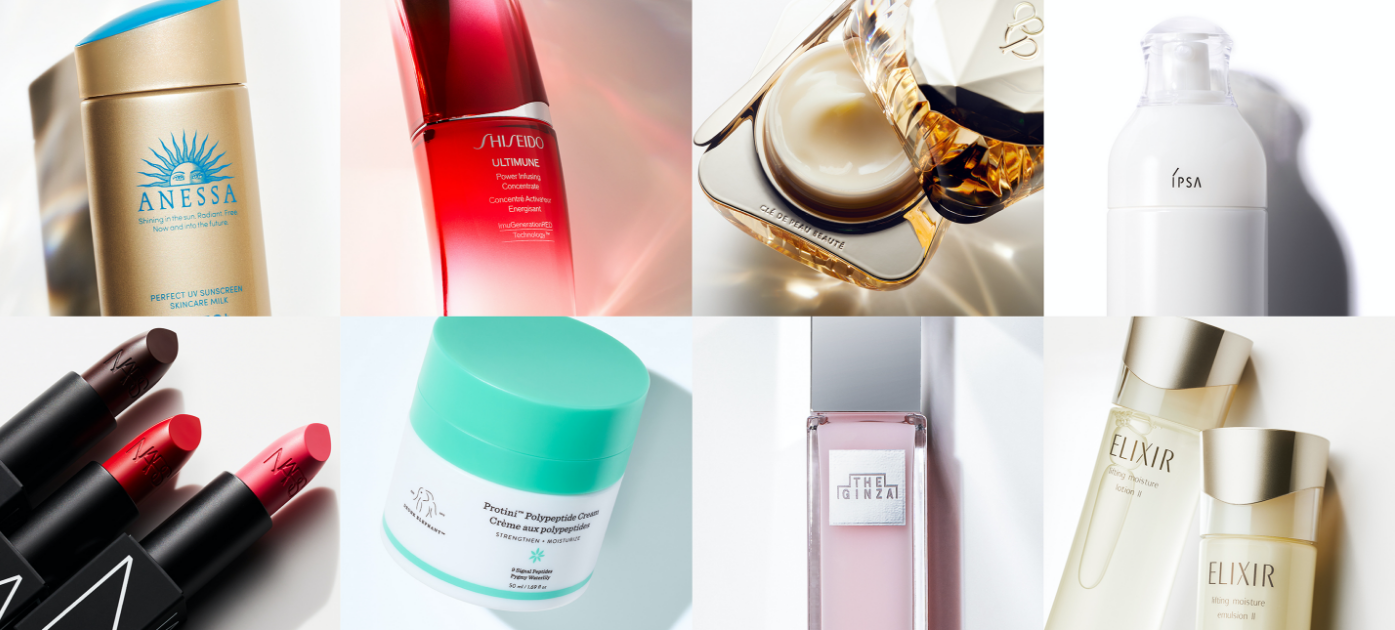
BUSINESS
CATEGORIES
Research & Development
- Awards Received at IFSCC
Congresses and Conferences - 29
- Brand Development / R&D Investments
- ¥36.5bn
Ratio to Net Sales
3.5%
- Ratio to Net Sales
- 3.5%
- Number of researchers
- Approx.1,200

R&D