About SHISEIDO
Facts & Figures


Corporate Information

- Founded
- 1872
- Position amongst Global Manufacturers
- No.5
- Position amongst Japan and Asia Cosmetics Manufacturers
- No.1
Global Expansion
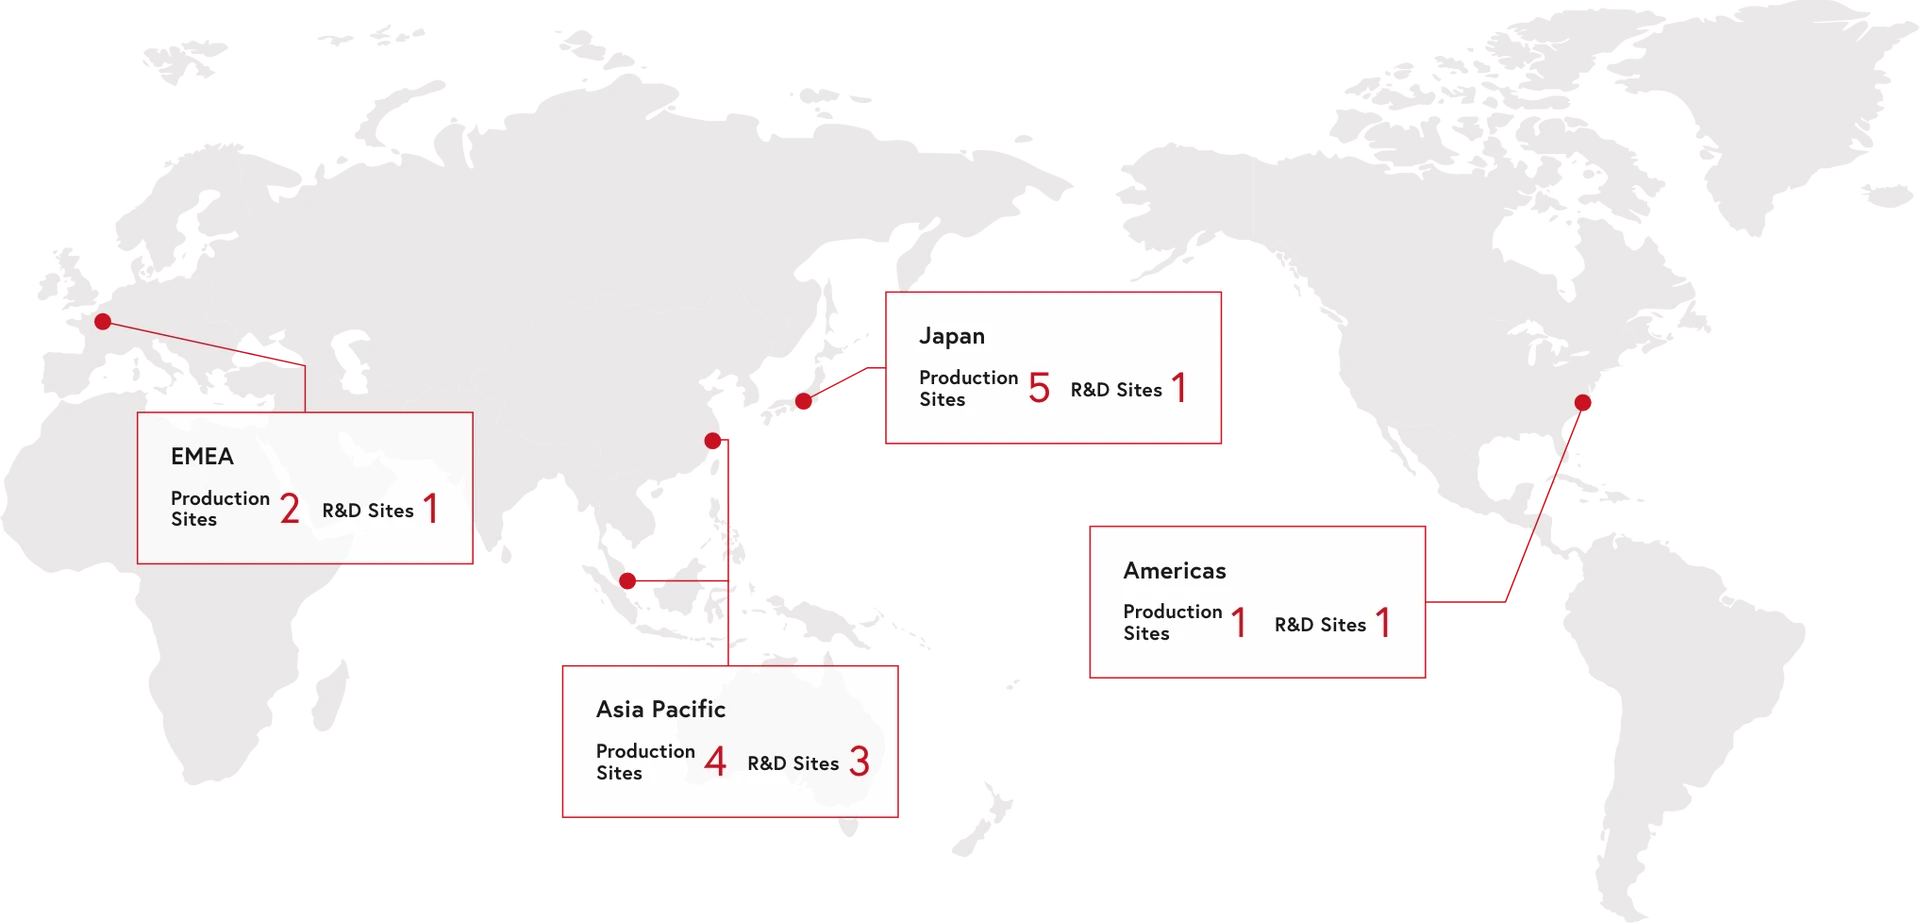
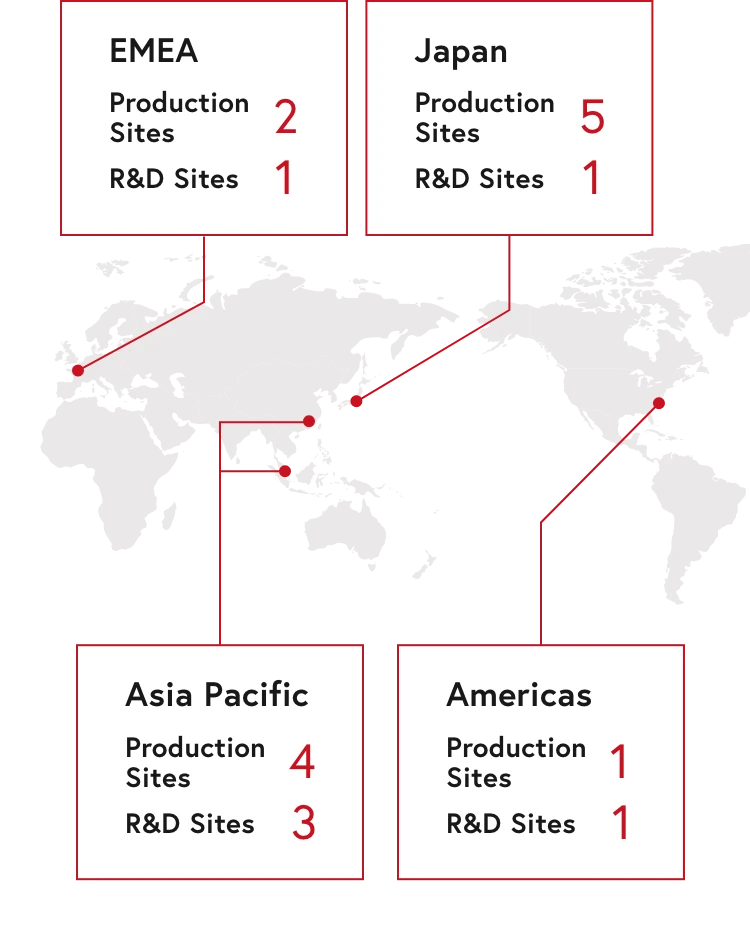
- Countries and Regions Served
- Approx. 120
- Production Sites
- 12
- R&D Sites
- 6
Employees

- Employees
- Approx. 39,000
- Nationalities Employed
- Approx.100
- Percentage of Female Managers
- 58.1%
Japan37.6%
Overseas72.0%
2022 Results
- Net Sales
- ¥1,067.4bn
- Core Operating Profit
- ¥51.3bn
- Core Operating Profit Margin
- 4.8%
YoY
+5.7%
FX-neutral
-3.9%
Like-for-like
+0.9%
YoY
+20.6%
YoY
+0.6pts
- ROIC
- 5.2%
- ROE
- 6.0%
Net Sales and Sales Ratio by Reportable Segment YoY growth (like-for-like)
- Share of Total SalesNet SalesYoY
Japan
22.3%
- Net Sales
- ¥237.6bn
- YoY
- +0.3%
China
24.2%
- Net Sales
- ¥258.2bn
- YoY
- -9.8%
Asia Pacific
6.4%
- Net Sales
- ¥68.0bn
- YoY
- +13.0%
Americas
12.9%
- Net Sales
- ¥137.9bn
- YoY
- +8.8%
EMEA
12.0%
- Net Sales
- ¥128.4bn
- YoY
- +4.0%
Travel Retail
15.3%
- Net Sales
- ¥163.7bn
- YoY
- +14.2%
Professional
0.9%
- Net Sales
- ¥9.3bn
- YoY
- -
Others
6.0%
- Net Sales
- ¥64.2bn
- YoY
- -3.4%

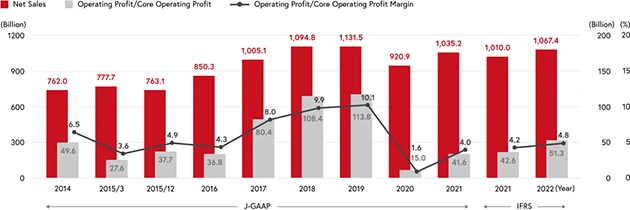
Net Sales/Operating Profit/Operating Profit Margin
Focus Growth Areas
- EC Sales Ratio
- 33%
Research &
Development

- Awards Received at IFSCC
Congresses and Conferences - 29
- R&D Investments
- ¥26.7bn
Ratio to Net Sales2.5%
- Number of researchers
- Approx.1,200