RESEARCH
Measuring Inclusion by
Making the Invisible Visible
Through Data
November 2025 (Japan)


Beyond Diversity:
A Prescription for Inclusion
While promoting DE&I, it can be difficult to see the reality of our own organization or departments. To address this challenge faced by many HR and DE&I professionals, the Shiseido DE&I Lab embarked on an initiative to visualize inclusion among a subset of domestic employees. The results revealed each organization’s level of inclusion through a four-quadrant map, clarifying the nature of challenges facing different units. This article shares the organizational realities uncovered through measurement and practical approaches to transform data into organizational change.
INDEX
01
What Is Inclusion and Why Does It Matter?
Defining Inclusion
Inclusion refers to an organizational state where diverse talent not only gathers, but where each individual is accepted as a valued member and can perform to their fullest potential. A commonly used metaphor illustrates this well: “being invited to the party (diversity)” versus “being asked to dance (inclusion).” No matter how diverse the people you hire are, if they aren’t truly accepted and empowered to be authentic to themselves, the value of diversity remains unrealized. Inclusion is what lies beyond diversity.
Why Inclusion Matters—The Business Impact Demonstrated by Research
The importance of inclusion has been validated by numerous studies. Catalyst research (2020) demonstrates that when employees feel included, their intent to stay with the organization increases. This helps prevent the loss of talented individuals and maintain organizational stability. The same research reports that inclusive workplaces see significant increases in creativity, innovation, and openness. When people feel their opinions are welcomed, new ideas emerge more readily. Furthermore, McKinsey research (2020) shows that higher inclusion correlates with stronger business performance, revealing that it isn’t merely a workplace environment issue but one directly linked to business outcomes.
However, inclusion faces a fundamental challenge: it’s difficult to see. Relying on subjective impressions like “good atmosphere” makes it impossible to accurately grasp the current state or measure improvement. So how can we measure it?
Three Meaningful Outcomes of Measurement
Measuring inclusion provides concrete direction for organizational transformation.
1.From “Intuition” to “Reliable Data”
“Our workplace has a good vibe” or “teamwork is good”—such impressions alone cannot identify where improvement is truly needed. Only through measurement does the distance between an organization’s current position and its desired state become numerically clear.
2.Evidence for the “Correct Use” of Limited Resources
Not every initiative can receive equal time and budget. Where should we begin? Which efforts are producing results? With data, strategic decision-making based on priorities becomes possible. Moreover, you can explain to leadership “why this initiative is necessary” grounded in facts and evidence.
3.Finding “Seeds of Success” Within Large Organizations
In large organizations, excellent practices likely already exist in some departments. However, without data, locating them becomes difficult. If data can identify departments promoting inclusion, their innovations and success factors can be examined with high confidence and horizontally deployed to other departments.
02
Measuring Inclusion—What the Four-Quadrant Map Reveals About Organizations
The Two Dimensions of Work Group Inclusion
The Work Group Inclusion (WGI) framework adopted for these measurements consists of ten questions and captures inclusion along two dimensions.* The first is belongingness—the sense of being accepted as a team member. The second is uniqueness—the sense that one can be authentic and have one’s individuality and strengths recognized. True inclusion exists when both these elements are satisfied.
Four Quadrants of Organizational States
Based on high or low levels of belongingness and uniqueness, organizations fall into four quadrants:
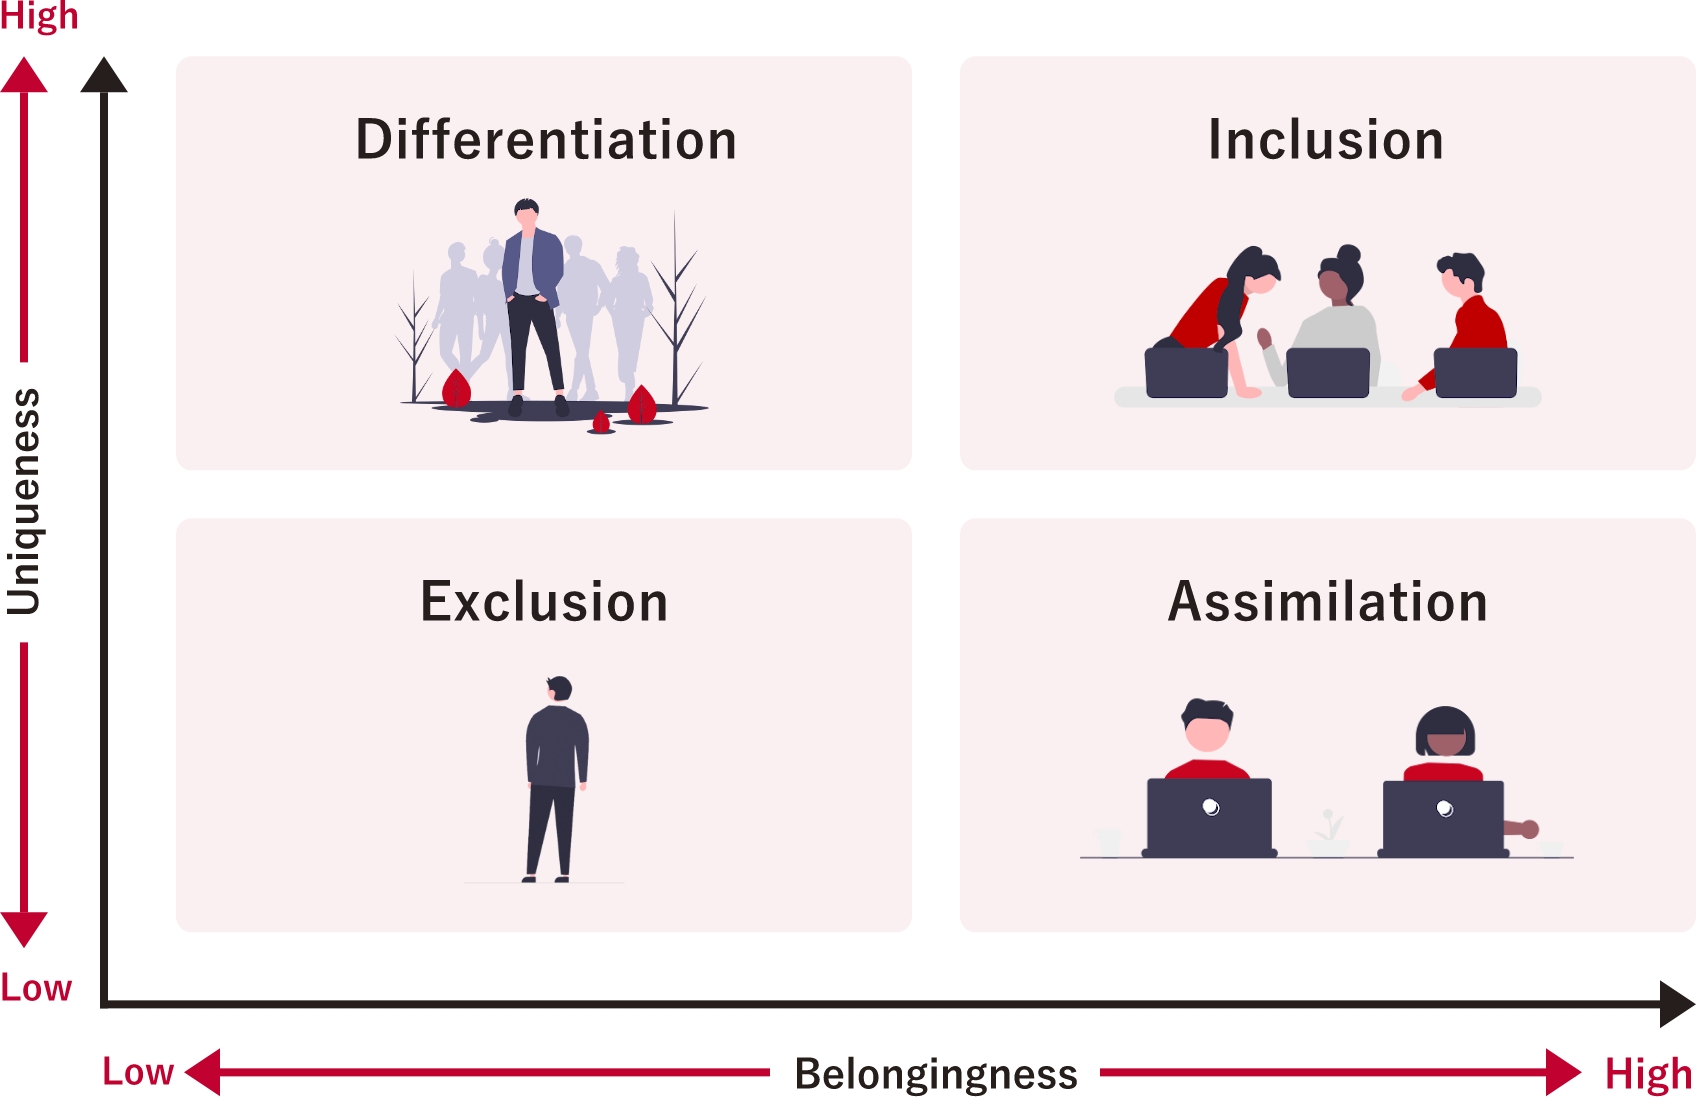
-
High Belongingness × High Uniqueness: The Ideal Inclusion
A state where team cohesion exists while each person’s individuality and strengths are respected. This represents the highest-performing organizational state where innovation thrives.
-
High Belongingness × Low Uniqueness: Assimilation
Team bonds are strong, but diverse opinions and new ideas struggle to emerge. While the atmosphere may appear positive, diverse perspectives may not be fully leveraged.
-
Low Belongingness × High Uniqueness: Differentiation
Individual personalities and ideas are respected, but team connections are weak. The organization faces challenges with unity and teamwork.
-
Low Belongingness × Low Uniqueness: Exclusion
Both belongingness and uniqueness are low; members feel neither accepted nor able to be authentic. Improvement on both fronts is urgently needed.
What the Measurement Results Revealed
What became clear from our measurements was the fact that positions within the quadrants vary significantly by department, even within the same company. Even with company-wide DE&I promotion, actual workplace-level inclusion varies far more than anticipated.
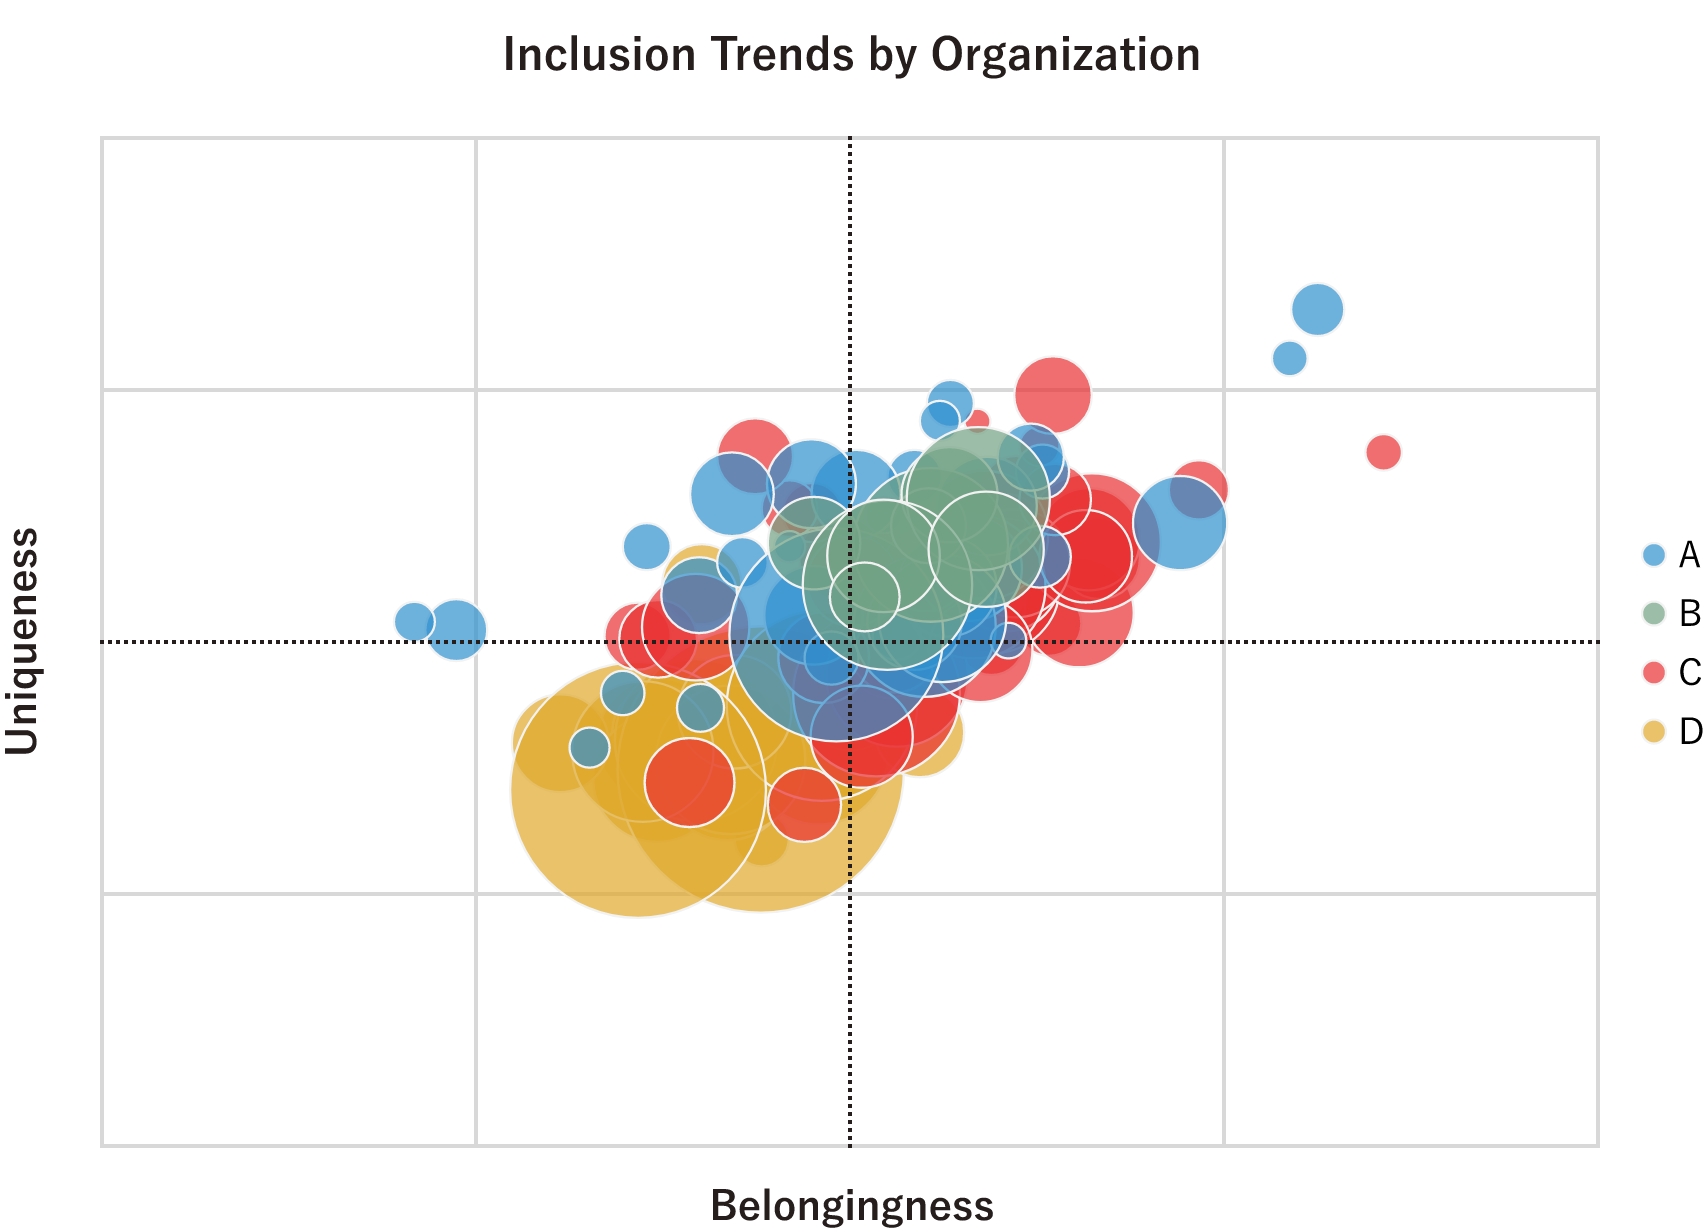
As this graph demonstrates, the state of inclusion differs considerably by department. This variance itself was a key discovery. Despite uniform DE&I promotion across the company, actual workplaces showed significantly different values for belongingness and uniqueness. These differences—invisible through intuition alone—were visualized for the first time through measurement.
03
Connecting Data to Organizational Transformation
Different Approaches for Each Quadrant
A major reason for inclusion measurement is to identify the nature of challenges an organization faces. This enables targeted, data-informed interventions.
Assimilation organizations require cultural development that enhances psychological safety and welcomes diverse opinions. Consider equalizing speaking opportunities in meetings, establishing mechanisms that encourage dissenting views, and fostering a culture of learning from failure. For specific initiatives effective for this organizational type, please see our detailed discussion here.
Differentiation organizations require team-building and initiatives that deepen mutual understanding, such as establishing regular opportunities for dialogue and promoting collaborative projects.
Exclusion organizations need to take a comprehensive approach addressing both belongingness and uniqueness.
As shown, appropriate initiatives differ by quadrant. We plan to share detailed examples and insights relevant to each quadrant in the future.
Learning from Best Practices and Horizontal Deployment
Another use of data involves extracting best practices from departments with strong results and deploying their success factors broadly.
In-depth interviews with high-inclusion departments can reveal specific managerial behaviors and team management innovations. Beyond exploring challenges, organizing these success factors into reproducible forms for other departments drives the enhancement of inclusion across the organization. The larger the organization, the higher the likelihood that excellent practices already exist internally, meaning that data becomes a powerful tool for discovering them.
Inclusion is a measurable organizational indicator and an improvable management challenge.
Visualizing inclusion helps clarify the organizational reality, identify the nature of challenges, and guide effective actions. Above all, data-driven dialogue transforms organizations. The Shiseido DE&I Lab will continue its detailed analysis of measurement results and dive deep into the practices adopted by high-inclusion organizations. We look forward to continuing to share our journey of making inclusion visible and changeable.
*This section references the following literature:
Chung, B. G., Ehrhart, K. H., Shore, L. M., Randel, A. E., Dean, M. A., & Kedharnath, U.(2020). Work group inclusion: Test of a scale and model. Group and Organization Management, 45(1), 75─102.
Shore, L. M., Randel, A. E., Chung, B. G., Dean, M. A., Ehrhart, K. H., & Singh, G.(2011). Inclusion and diversity in work groups: A review and model for future research. Journal of Management, 37, 1262─1289.
山本華. 日本語版職場におけるインクルージョン尺度の作成と信頼性・妥当性の検討. 横浜国際社会科学研究 27.3 (2023): 53-65.
Statistical Analysis Team:
Shintaro Yamaguchi (University of Tokyo), Yoko Okuyama (Uppsala University), Keisuke Tsugumi (Hitotsubashi University), Yuma Oshima (University of Tokyo), Sae Yamamoto (University of Tokyo)